Continuation of This Momentum in Future Years

A_Carina/E+ via Getty Images
Many would agree that the holy grail of investing is being able to "time the market". Timing the market can mean pulling out before a major drawdown, or taking positions in specific stocks or factors before they are about to take off. With the market today in such an uncertain state with inflation at levels not seen in decades, the idea of timing the market, or at the very least understanding what is driving returns can be very helpful.
That said, many would also agree that market timing is a fool's errand - while it sounds incredibly wonderful, it is very difficult, if not impossible to achieve in real-time.
Whether or not one can actually "time the market" has been a mild obsession of mine for the last year, as I've reviewed and analyzed different methods and strategies on the subject. I wrote about some variations of market regimes and timing on and buy and hold and timing recessions.
I will not bore you with the details, but nearly every system or method I've come across to "time the market" has shown little promise at best, or worse has fallen apart in out of sample testing. The only strategy that has produced consistent out of sample performance is that of Crisis Investing, which I was able to test in real-time during the 2020 crisis and recovery. Still, crises by definition do not occur very often, and are more special (rare) situations than timing the market on a regular basis.
Conventional market timing is typically intended to capture market moves before they happen, and often uses macro or market signals for entry and exit, based on past events. This challenge with this approach is that the signals that worked in the past may not be applicable in today's market, particularly if you believe that the market is a complex adaptive system, as I do.
Perhaps a better approach is to adapt to the market once it has already changed in real time. This is the idea behind trend following, the mantra being "the trend is your friend". Trend following is typically associated with very broad changes in the market i.e. indices, currencies etc. My investing focus is in portfolios of a concentrated number of stocks, typically 20-30, based on quantitative investing factors (value, growth, quality, etc); in my experience, this is where the most alpha is available to be harvested.
What about combining factor investing with some form of trend following?
"Factor Momentum" is relatively new in the academic literature (see here and here for example). The main thesis of factor momentum is that factors that have outperformed recently should continue to outperform. There are different ways to measure factor momentum (not to be confused with the investing factor "momentum", more on this below), and there are mixed conclusions in the literature on whether it is effective in predicting future returns.
The main appeal of factor momentum, in theory, is that it can help avoid those extended periods of underperformance that most factors experience over time.
A common response to the idea of any type of market timing from "buy and hold" factor investors is "I'm in it for the long term, and don't care about a factor's short term performance". This can be a viable approach, however while most traditional factors (value, growth, low beta, etc) have outperformed over the long term, they can also experience extended periods of underperformance, and even "factor inversion". Factor inversion is where performance of the factor's high-ranking stocks are outperformed by the lower ranked stocks. This happens more often that you'd think for value (when expensive stocks outperform "cheap" stocks) and low volatility, or beta (when high beta outperforms low beta).
How well one can manage underperformance and volatility in their portfolio varies person to person. We all have different investing personalities, are at different points in our investing careers with different goals (wealth accumulation vs wealth preservation), and we respond differently to volatility in our portfolios. As a buy and hold investor, experiencing a factor (or strategy) inversion may be incredibly painful, and may lead to selling off the strategy at precisely the wrong moment (when the factor inverts again).
Knowing how a factor is performing, or trending relative to the market, can be helpful to at least understand what is driving performance in the market and a strategy.
Can factor momentum successfully time the market? Can recent past performance of factor(s) predict future performance, or at least enhance conventional factor investing? Or is factor momentum another strategy that can be tossed into the "market timing is futile" pile?
In this series, my goal is to break down factor momentum, see how effective it has been historically, and look at ways to implement into real trading.
Defining "Factor Momentum"
As described above, factor momentum is the idea that any given factor, take it value, growth, quality, low beta, if outperforming in the recent past, should continue to outperform in the future.
Before we get any further, let's clarify some terminology. "Factor momentum" is similar to, but not the same as the factor "momentum", which is buying stocks that have risen in price recently in anticipation of their price to continue to rise in the future. In this case, "momentum" is looking at a basket of stocks based on price movement of the stock, where "factor momentum" looks at the price action of the underlying factors, i.e. value, growth, quality etc of those stocks.
"Momentum" stocks can have "factor momentum", this just means that "momentum" stocks are rising in price and outperforming the market. There will be a time however when the "momentum" factor is not working, at which time these "momentum" stocks will have negative "factor momentum".
Factor Investing - Long term outperformance vs short term inversions
An effective way of looking at factor performance is through rank charts. Over a given period, all stocks are ranked, and grouped into ten (10) groups, or deciles. The highest decile contains the 10% highest ranking stocks for the factor, the bottom decile the lowest 10% ranking stocks, with the remaining deciles in between. At time of rebalance (say 1 month, or 3 months, 1 year), stocks are re-ranked in their respective deciles. Over the full test period, the aggregate return of the various deciles are then calculated.
The rank chart below shows the returns of deciles for a value factor ranking system since 1999:
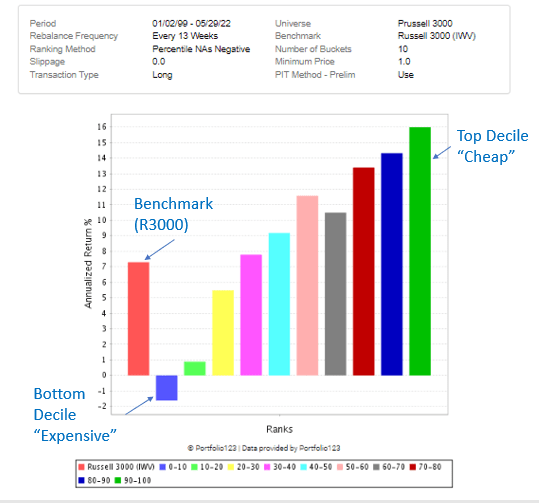
Portfolio123 chart, Author annotation
We see that since 1999, the highest ranking stocks, on average, have produced an annualized return of roughly 16%, the bottom decile -2%, compared to the R3000 (IWV) of 7% over the same period, all rebalanced quarterly.
In my experience, looking at very long periods of performance for any asset, factor, or strategy, gives you a quick reference point, but you miss all of the shorter periods that happened in between, which could have performed much better, or much (much) worse than the 23 year average.
Let's repeat the exercise for our value system, but over the shorter period 1999-2001:
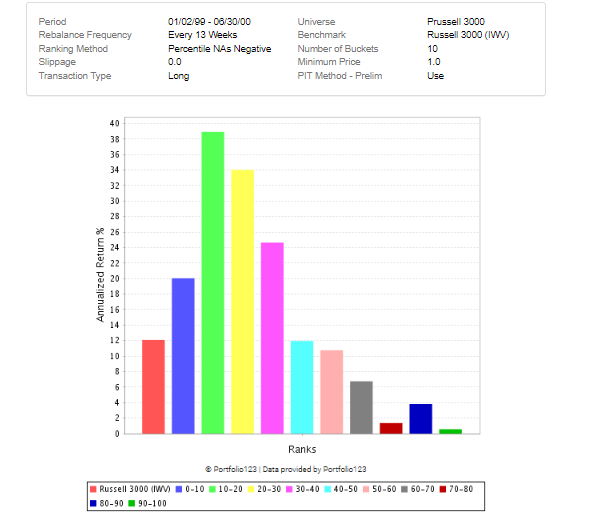
Portfolio123 rank chart
Here we have a textbook factor inversion. Where value has outperformed "over long periods of time", it was absolutely crushed in the early stages of the internet bubble. Here the lower ranked value stocks, or those being "expensive", crushed those stocks with less lofty valuations ("cheap", higher ranked deciles).
Inversion of the value factor is not a unique phenomenon to the internet bubble, there have been several value inversions since. Even the extended 5 year period from 2015 until the end of 2019 experienced a value inversion:
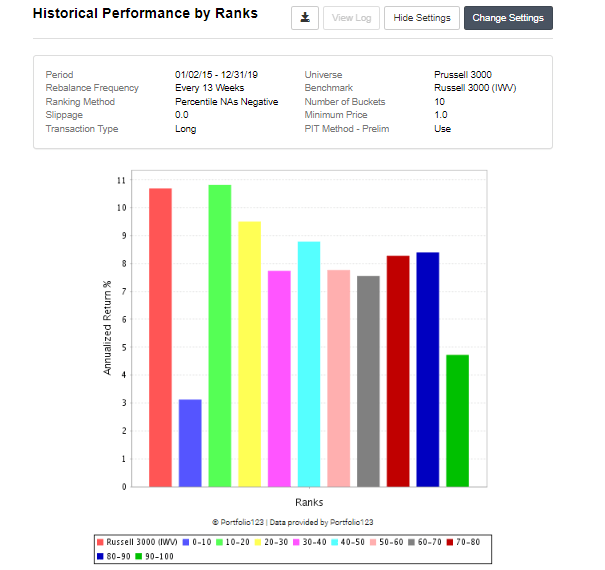
Portfolio123 rank chart
Where the cheapest stocks underperformed all other deciles except the most expensive.
Factor inversion is not unique to value, the same types of inversions occur to the other factors as well, growth, low beta, quality, etc.
If an investor has a buy and hold value portfolio with holdings in the cheapest decile, then s/he will experience these long periods of underperformance. Some believe that underperformance is required for long term outperformance, but realistically, this type of volatility can be gut-wrenching and challenge an investor's ability to hold on.
What is causing these inversions? Simply put, it comes down to an essential driver of stock market returns: demand. At any given time, certain stocks, industries, and factors are in favour, and will naturally attract buyers, which in turn bid up the prices of the underlying assets/stocks. These stocks may have improving fundamentals, or the market values the fundamentals (or some other factor, the story or narrative) more than previously, so multiple expansion ensues. Or, both happen at the same time. This then means that there will be times where cheap stocks thrive, and others where expensive stocks appeal to the market with their growth narratives, whether just or not.
Can factor momentum be used to signal when demand is improving for a factor, and to avoid these drawdowns and volatility in factors? Can recent past performance be a signal for future performance?
Let's get into it.
Factor Momentum - Measuring the Performance
There are several ways to define factor momentum. An academic approach is to see how the factor has performed compared to other factors, or whether the factor has outperformed the market.
The approach I take is as follows. Using the rank chart approach above, we take the recent performance of the top ranking decile (highest 10% raked stocks for the factor), and compare it to the broader market benchmark over the same period. If the decile beat the benchmark, then we have positive factor momentum. If the decile underperformed, then we have negative factor momentum.
In terms of periods, I look at two separate periods:
- most recent 3 month period, and
- the most recent 1 month period.
We can then use variations of these metrics:
- Strong factor momentum - factor beats benchmark on both most recent 3 month and 1 month periods
- Accelerating factor momentum - 1 month outperformance is higher than 3 month outperformance
In terms of factors, we will look at 6 major investing factor groups:
- Value
- Growth
- Quality
- Momentum
- Low volatility
- Sentiment
Instead of looking at a single factor for each of the groups (as is often done in academia), we will use a composite ranking system for each group, comprised of 8-12 different factors.
For example, the value group includes price to earnings (P/E), price to book (P/B), price to cash flow (P/FCF), among several others (see each factor section below for more details on each).
These ranking systems are publicly available at Portfolio123, and all tests in this piece were tested at P123 as well. Links to each ranking system will be provided below.
A test to see how effective factor momentum has been is to compare the returns to a simple buy and hold strategy for the given factor. In other words, what has produced better returns, buying and selling a factor based on its price action, or simply buying and holding the factor and stomaching the volatility?
To compare returns of these two strategies, we can't compare CAGR of both strategies, as the buy and hold would have a CAGR over the fully invested period, and factor momentum would only be effective for a fraction of the time (as the factors are typically in momentum roughly 50% of the time). To compare apples to apples, I've looked at monthly returns for both strategies, as the rebalance period is also 1 month. This way we can look at both average and median monthly returns to try and compare the strategies side by side.
Our full test period is Jun 1999 until today (late May 2022). Our base case "buy and hold" strategy for each factor buys the top 10% ranked stocks and rebalances monthly.
Our various test cases for factor momentum buys the top 10% ranked stocks only if the previous 1 month or 3 month performance of the top ranked decile of the factor has beaten the benchmark over the same period.
I've chosen the Russell 3000 as our main testing universe and benchmark to capture the broadest selection of stocks. In further installments we'll look at parsing stocks into sub-universes based on industry, size, QQQ vs SPY, etc.
Now let's get into each of our factors.
Factor Momentum - Growth
Our growth ranking system includes factors based on earnings per share (EPS) growth, sales growth, and operating income growth, each over different periods, and how they are changing over time (acceleration of the growth), as shown below:
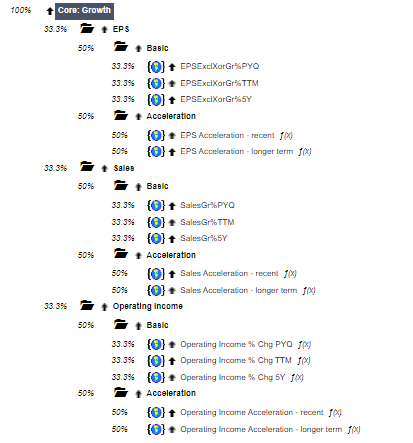
Source: Portfolio123
Over our full test period, high growth has tended to outperform low growth:
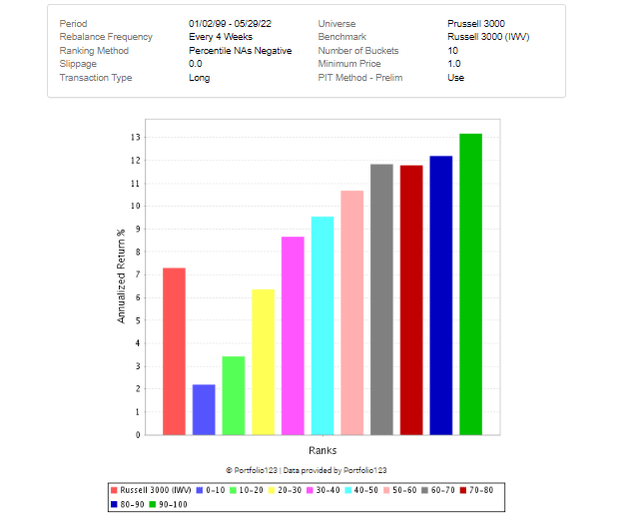
Portolio123 rank chart
This is a textbook rank chart, with the highest ranking growth stocks with the best performance, and lower ranking deciles with gradually decreasing performance.
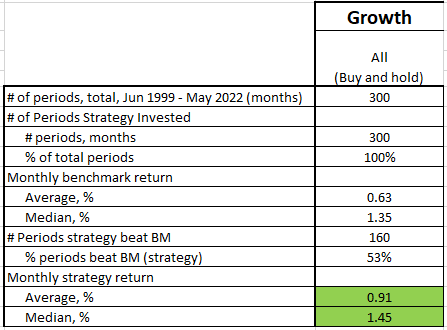
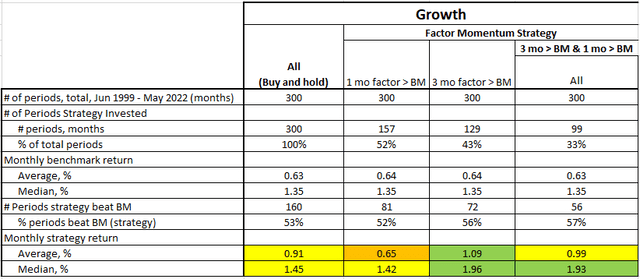
The table below summarizes monthly returns of the top growth decile and the R3000 benchmark.
Portfolio123 data, Author Table
Over the full period, the average monthly and median returns of the R3000 has been 0.63% and 1.35% respectively.
Taking a buy and hold approach on our growth factor (buying top 10% ranked growth stocks, rebalancing monthly), we would have beaten the R3000 both on an average and median monthly basis, at 0.91% & 1.45% respectively - not too bad.
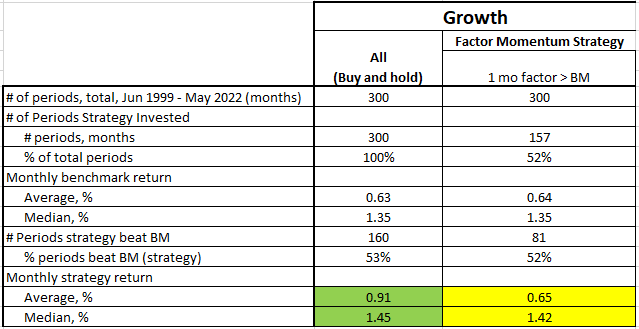
Let's now look at our factor momentum strategies. If we use prior 1 month performance of the growth factor when outperforming the R3000, then we take positions in the top decile of the growth factor, rebalancing monthly. Performance is summarized below:
Portfolio123 data, Author Table
First off, of the 300 months of our 23 year period, in 52% of those months the 1 month performance of the growth factor outperformed the benchmark. If we only invest in the growth factor following 1 month outperformance, the average and median monthly performance roughly matches that of the R3000 and buy and hold growth strategy (but lags the buy and hold on an average basis).
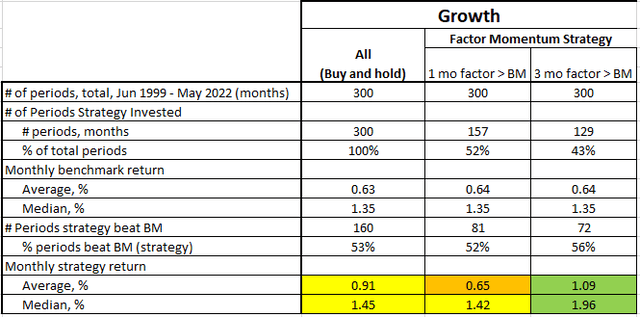
If we extend our momentum period to 3 months, performance is as follows:
Portfolio123 data, Author Table
The 3 month version of the strategy is invested less often than the 1 month version (43% vs 53%), however performance improves markedly both on an average and median monthly basis of 1.09% and 1.96% respectively.
Now let's up the ante, and require that both the 3 month and 1 month performance of the growth factor need to have beaten the benchmark. If so, then the strategy goes long the top 10% of highest ranked growth stocks. The results are shown below:
Portfolio123 data, Author Table
As we are raising the bar, we are limiting our test cases. Of the 300 months of the full test period, only 33% included both 1 and 3 month prior outperformance. Still, monthly performance beat the R3000 on both average and median basis. Average performance more or less matched the simple buy and hold of growth, however on a median basis this strategy outperformed the buy and hold by a wide margin (1.93% vs 1.45%).
And finally, we can up the bar once again, looking at acceleration of the momentum factor. Specifically, if the 1 month outperformance is greater than the 3 month outperformance, we can theorize that the factor is attracting attention in the market, and has the potential to be a strong signal for future returns. Results of this case are shown below:
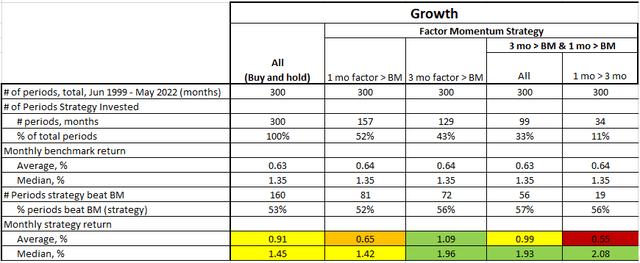
Portfolio123 data, Author Table
This situation is not frequent, as only it only occurred in 11% of the 300 months of the entire test period. With so few results, performance should be taken with a grain of salt as these may not be statistically significant. Still, it is interesting to see that even on a median basis, the growth factor continues to outperform when there is acceleration in the factor.
To sum up our growth factor, it does appear to be sensitive to factor momentum, i.e. previous outperformance in the growth factor tends to suggest future outperformance, particularly on a 3 month momentum basis. On a factor momentum acceleration basis, results are mixed, but may be less statistically significant due to the small sample size.
Let's move on to our next factor, low volatility.
Factor Momentum - Low Volatility
The low volatility factors look at those stocks with the most stable past returns. Past returns can be measured through a variety of sub-factors, from beta, to variance and standard deviation, etc.
"Lottery stocks" are those stocks that are perceived by some investors to be a moonshot, positioned to be a 10x, 100X or 1000x. These stocks are typically characterized by very volatile past returns, with some investors buying and selling into them with high frequency.
Our low volatility ranking system is as follows:
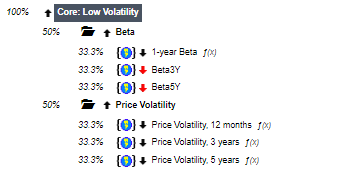
Source: Portfolio123
Over long periods, low volatility tends to outperform high volatility, as per the rank chart below for the R3000:
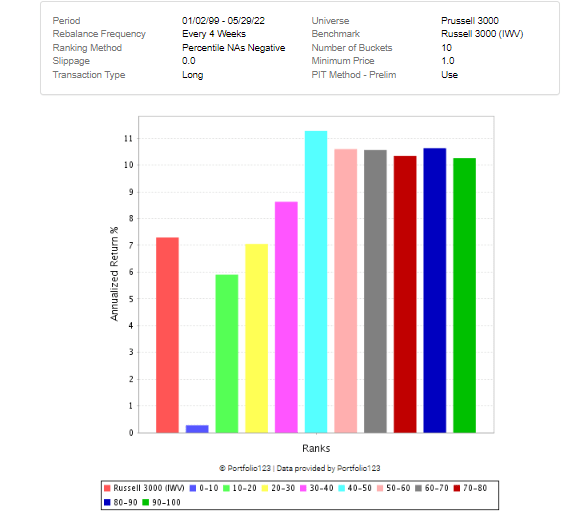
Portfolio123 rank chart
Notable here is that the lowest volatility stocks (top decile) have not enjoyed outperformance of their nearby lower ranking deciles. In fact, the top 6 deciles have more or less the same performance over the period; it is not until we reach the lowest 4 deciles that performance drops off. This suggests that low volatility may not be a strong factor, at least on its own (we will get into factor matching and complementing in a future installment).
The table below summarizes the low volatility factor in our different factor momentum strategies:
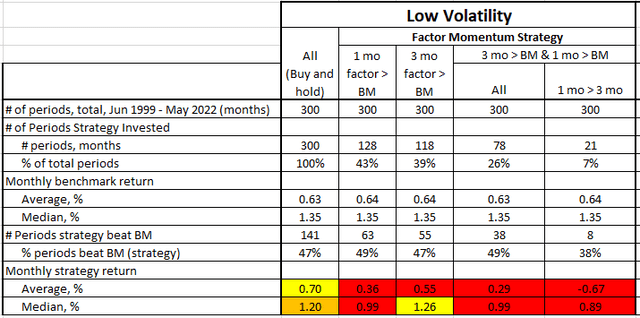
Portfolio123 data, Author Table
Generally our low vol strategy has not fared well, on several levels. First, a simple buy and hold just matched or trailed the R3000 benchmark (which shouldn't be a surprise from the rank chart above).
Second, our 1 month and 3 month factor momentum strategies also mostly trailed or matched the benchmark and buy and hold strategy. Whereas our growth strategy was invested in 52% and 43% of the periods, low vol experienced less periods of factor momentum at 43% and 39% respectively.
On an average basis, returns for 1 and 3 month factor momentum are significantly less than a simple buy and hold and the benchmark, with median returns just matching buy and hold (but trailing the benchmark).
As low vol has less periods of outperformance on a 1 and 3 month basis, it also has less occurrences of outperformance together. In the cases where low vol outperforms on a 1 and 3 month basis, future performance trails buy and hold and the benchmark by a wide margin.
In summary, low vol has not been a strong factor on its own. Looking at low vol through the lens of factor momentum has only amplified its weakness, suggesting that factor momentum may not be suitable for the low volatility factor.
Factor Momentum - Quality
Second to value, quality is quite possibly the most touted factor in investing books, podcasts and blogs, and makes much intuitive sense. The best investments should be the highest quality, right? Well, everyone has an opinion, but to me the data tell the real story.
Our quality factor ranking system is summarized below:
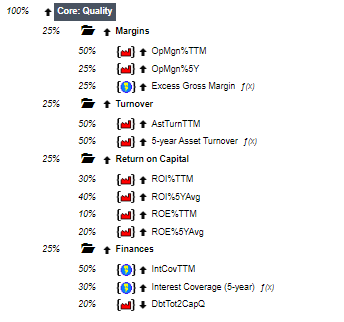
Source: Portfolio123
This ranking system has a wide array of sub-factors, ranging from elements of profitability (and margins), return on 'x' factors, quality of earnings, and of course balance sheet strength.
Over our full test period, the rank chart is as follows:
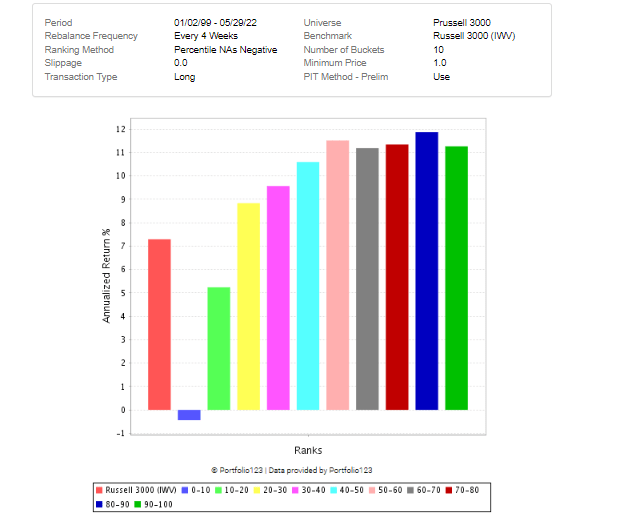
Portfolio123 rank chart
Similar to low volatility, there is little difference in returns between the highest 50% ranked stocks by quality. It is only the lowest ranking quality stocks that show much difference in returns.
The table below summarizes performance of our quality stocks, both as buy and hold as in our factor momentum strategies:
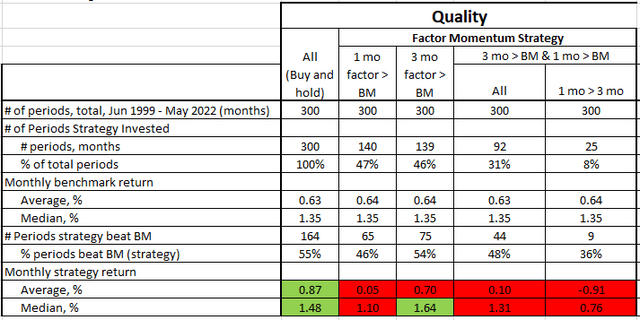
Portfolio123 data, Author Table
A simple buy and hold quality strategy would have marginally beat the benchmark R3000 on both an average and median monthly return basis.
Following 1 and 3 month outperformance of the benchmark, the highest ranking 10% of quality factor stocks have significantly underperformed in future periods on an average basis. Only 3 month momentum showed some outperformance on a median basis. This may suggest that quality is highly mean reverting, i.e. after some outperformance these stocks settle down and tend to underperform.
In our more aggressive strategy requiring both prior 1 and 3 month returns to beat the benchmark, performances again significantly lagged on an average and median basis. Our smaller group of periods requiring both 1 and 3 month factor momentum and factor acceleration have underperformed for quality in both cases.
These results suggest that quality has not been a suitable candidate for factor momentum. Again, this is the quality factor in isolation; in future installments we will see how combinations of factors are impacted by factor momentum.
Factor Momentum - Momentum
Looking at factor momentum for the momentum factor appears to be the same thing, but in fact there is a difference. What we are looking at is the momentum of the momentum factor.
Our ranking system for momentum is shown below:
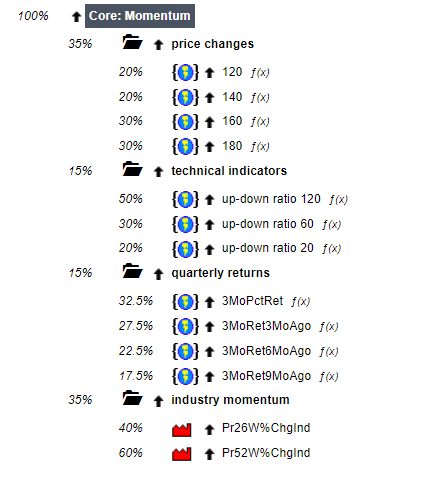
Source: Portfolio123
This factor group includes factors capturing price movements of individual stocks over different periods, and also of the respective industries as well.
The rank chart for the momentum factor since 1999 is shown below:
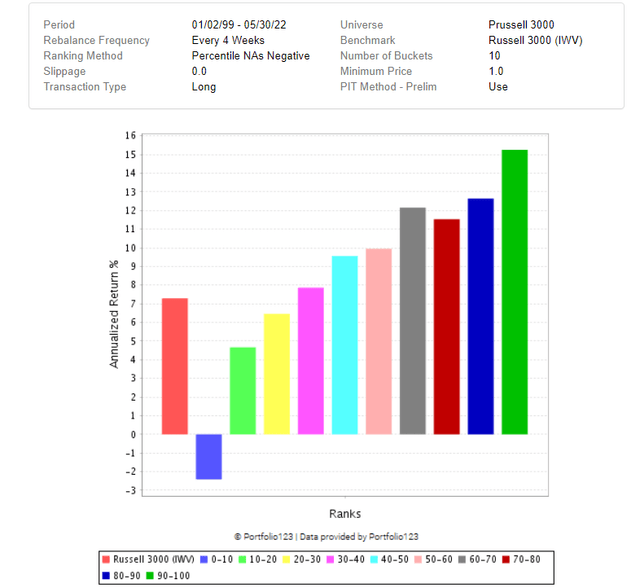
Portfolio123 rank chart
This is also a textbook rank chart, with lower ranking deciles sloping downwards until the lowest decile, which has returned negative returns.
Our summary of results of factor momentum for the momentum factor is shown in the table below.
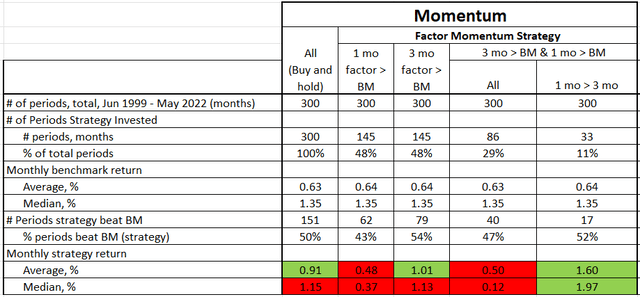
Portfolio123 data, Author Table
On a monthly return basis, a simple buy and hold momentum factor strategy would have beat the benchmark in terms of average return, but trailed on a median basis.
Looking at previous 1 month outperformance, the momentum factor has underperformed in future months. There is some improvement when looking at 3 month outperformance on an average basis, however the factor still underperforms on a median basis.
Not surprisingly, looking at periods outperforming the past 1 and 3 month benchmark have also resulted in future underperformance.
Looking at the rate of change (acceleration) of the factor momentum (previous 1 & 3 month outperformance, with 1 month outperformance of the 3 month), we have a small sample size with only 11% of the periods, however performance has been quite strong at 1.6% and 1.97% average and median monthly returns. This may suggest that factor momentum is finding the momentum factor in the early stages, however it is an infrequent occurrence.
Even with a strong rank chart since 1999, factor momentum applied to the momentum factor may in fact be too much momentum, if such thing is possible. Perhaps mean reversion is happening here, with stocks with the highest recent returns near or at their peak, with not much room to go but down.
Factor Momentum - Sentiment
The sentiment factor group attempts to characterize stocks based on how the market views them, predominately through analyst EPS estimate revisions (revising up is usually a sign of improving expectations), past earnings surprises, recommendations and the % short interest of the stock.
Sentiment factors are not directly based on the fundamentals, but rather how the market perceives the stock. For this reason, the sentiment factor can be a good addition to complement other factors such as value, growth or quality. That said, looking at sentiment in isolation at least gives us an idea of how it has performed.
See below for the ranking system sub-factors.
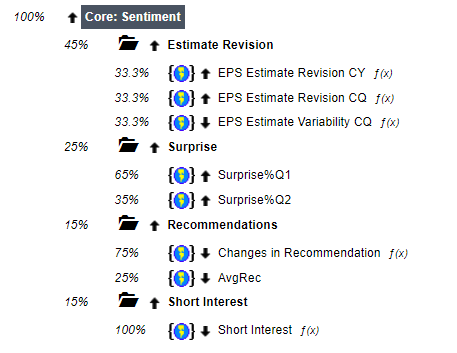
Source: Portfolio123
The sentiment rank chart since 1999 is as follows:
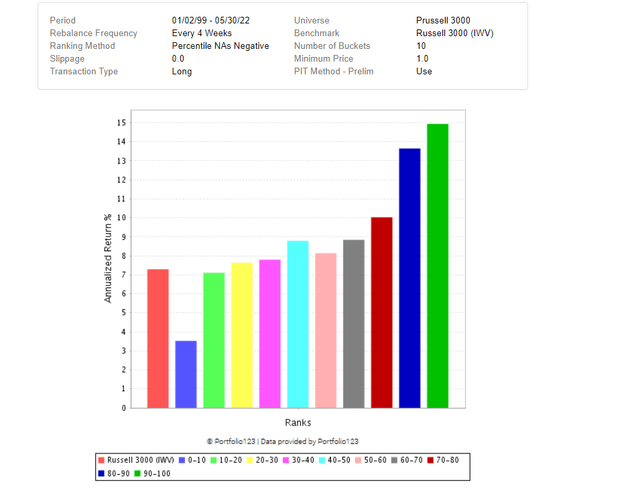
Portfolio123 rank chart
Here there is a clear spread of performance between the highest decile and lowest rank decile, however there is only real outperformance in the highest ranked stocks, where performance trails off at the middle deciles.
The performance of the sentiment factor is summarized below:
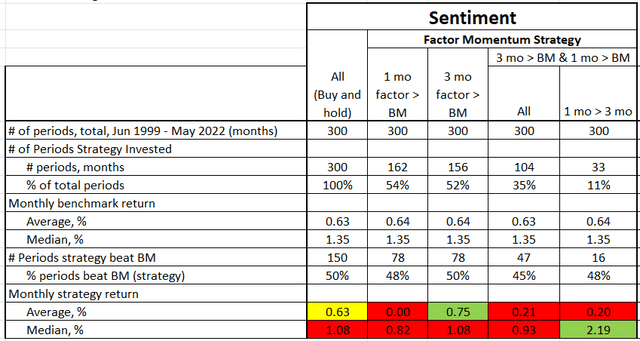
Portfolio123 data, Author Table
As a buy and hold factor, sentiment has essentially matched that of the benchmark on an average monthly return basis, but has trailed on a median basis.
For our factor momentum strategies, sentiment has trailed in nearly all cases, at times by a wide margin. It managed to slightly beat the 3 month factor momentum, and outperformed in our accelerating factor momentum strategy (but keeping in mind this is a much smaller sample size of only 33 months).
As sentiment is typically a complementary factor, it may explain some of this underperformance when it comes to factor momentum on its own.
Factor Momentum - Combining Factors
While some single factors (value, growth, quality) can make up a strategy, it is often more common to combine them. Think quality and value, which are combined into the Magic Formula, or growth and value in Peter Lynch's "Growth at a Reasonable Price".
To see how the factors work together in a factor momentum context, we will look at a ranking system combining all of the 6 factors above. The "Core Combination" ranking system does just this, and is available as a public ranking system at Portfolio123.com.
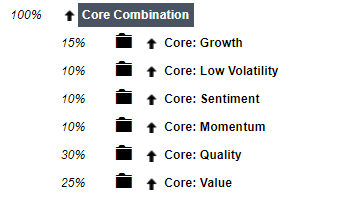
Source: Portfolio123
The weightings are the default, and I have not adjusted them for this exercise (however we could look at variations as well, i.e. equally weighted factors).
The Factor Momentum results are summarized below for our "All Factors" ranking system:
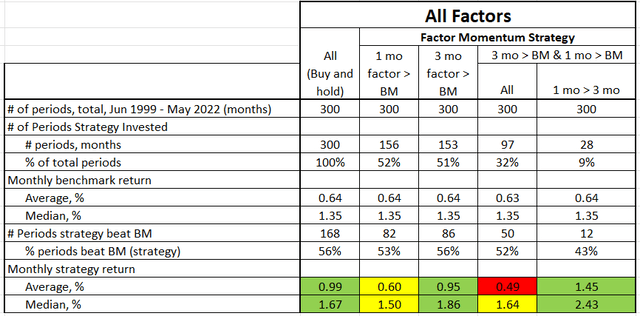
Portolio123 data, author table
Just buying and holding the top decile of the "All Factors" ranking system and rebalancing quarterly would have beat the R3000 on an average and median monthly basis.
Introducing factor momentum, on a one month basis actually detracts performance, while 3 month factor momentum enhances returns slightly on a median basis only. Looking at both 1 and 3 month factor momentum together, average returns drop significantly. Finally, looking for 1 & 3 month factor momentum with acceleration (1 month > 3 month), returns improve significantly (but with a very small sample size, reducing the statistical significance of this group).
Putting it all Together
To get a broad picture of the range of outcomes for factor momentum of the various factors, the table below includes the buy and hold results and factor momentum (1 and 3 month only) for our factors:
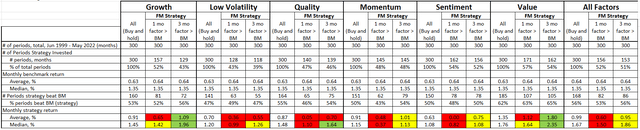
Portfolio123 data, author table
Since our aggressive factor momentum and factor acceleration have so few samples, we've removed from the table for this comparison to conserve space.
Performance of each factor is shown, and the factor momentum strategy returns highlighted green, yellow or red. Green cells indicate the factor momentum performance beats the buy and hold performance, yellow is matching more or less, and red is trailing.
Of the 6 factors, on a 1 month factor momentum basis, none actually outperform a simple buy and hold.
If we look at 3 month factor momentum, growth and value have benefitted from recent factor performance. Low volatility, quality, momentum and sentiment all show little change (or decrease) in performance.
While we did look at a more aggressive factor momentum strategies with both 1 and 3 month momentum, these results nearly all underperformed, perhaps in these cases the factor has risen so quickly, it is ripe for a mean reversion.
For what it's worth, from the table above we can also see the number of months that each factor experienced factor momentum. Most factors hover around 50%, +/- 5 or 10%, with value with the most number of months at 57% and 54% (1 month and 3 month factor momentum respectively), and low volatility with the fewest number of months in factor momentum at 43% and 39% (1 month and 3 month respectively).
Looking at the acceleration of factor momentum (1 month FM > 3 month FM), results were impressive, but with very few samples (only 10% of the time), suggesting the results are not statistically significant. This is still an interesting idea, something I will look further from different angles in the future.
As noted earlier, the number of periods varies between a buy and hold strategy, which is fully invested, to a factor momentum strategy, which is invested roughly 50% of the time (depending on the factor) as mentioned above. What does a strategy look like that invests in factor momentum?
To illustrate, take a buy and hold of the top decile of value stocks over our full period:
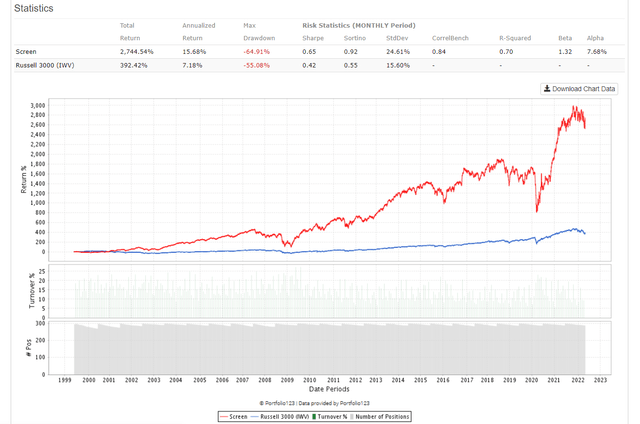
Portfolio123
A simple buy and hold of the top decile of value stocks has produced a CAGR of 15.7%, a max drawdown of 65%, with high volatility (24.6% standard deviation vs 15.6% for the R3000), and alpha of 7.7%.
Our 3 month factor momentum strategy for the value factor produces the following equity curve over the same period:
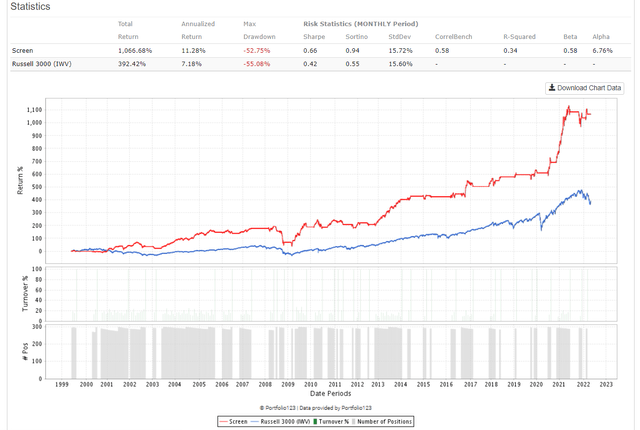
Portfolio123
CAGR of our value "factor timing" strategy is less than buy and hold (11.3% vs 15.7%), but with significantly lower volatility and less max drawdown. Alpha is slightly less than buy and hold, 6.8% vs 7.7%. That said, considering the strategy is invested almost half the time of the fully invested buy and hold strategy, this performance is notable.
What does Factor Momentum tell us about the market today?
With our factor momentum strategy, at any given time we can see which factors are outperforming the market. That said, if our results above are any indication, recent past performance is not necessarily indicative of future performance, depending on the factor.
The table below summarizes the median 1 and 3 month price performance for the top 10% ranked decile of each factor, and then compared with the benchmark R3000.
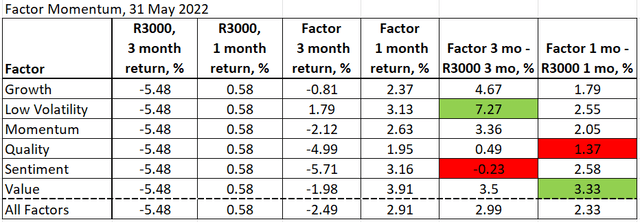
Portfolio123 data, Author Table
Low volatility has been a good performer in the last 3 months, outperforming the R3000 by the widest margin (possibly due to the high volatility stocks being crushed in the last 6-9 months and low vol returning to its historical average). High sentiment has had very poor performance in the last 3 months.
Over the last month, it has been value that has outperformed the other factors.
In this piece we have explored factor momentum, and whether the idea that past factor performance can predict future factor performance. As we have seen, of the 6 factors investigated, only the value and growth factors showed signs of promise in this regard. While I have attempted to take a comprehensive look at factor momentum, we are still only really scratching the surface. Each of our factors contains 8-12 sub-factors, which likely have their own sensitivities to factor momentum, and in turn only a few may be the drivers of the overall factor momentum. We could also look at sub-periods of our 23 year period to see if there has been any clustering of performance of factor momentum, or if it is time neutral. Or, does factor momentum favour smaller or larger stocks?
We have looked at these factors separately, what happens when we look at the factor momentum of different factors simultaneously?
And finally, will the trends we've found apply to a regime of higher inflation, or are they macro independent?
In future installments, we will look at factor momentum from these different angles, and more.
Until then, happy investing!
But before we go…
The tables below list the largest 25 stocks in the top decile of factor classes with some of the highest factor momentum at time of writing: low volatility, growth and value.
Low Volatility
BRK.B, JNJ, PG, WMT, PFE, KO, ABBV, PEP, MRK, TMO, VZ, ABT, CMCSA, MCD, TMUS, PM, TXN, BMY, T, AMGN, IBM, LMT, AMT, MO, MDLZ
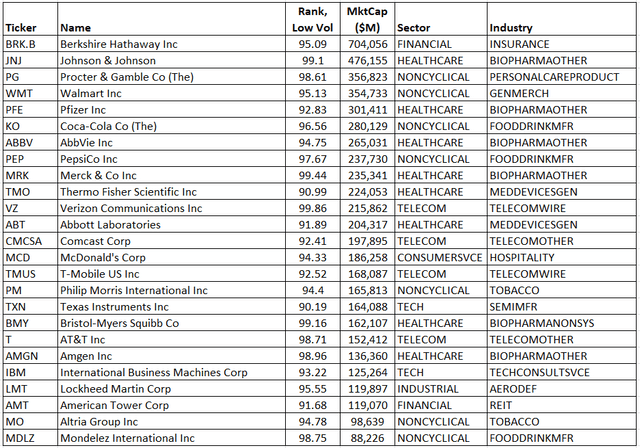
Portfolio123 data, author table
Value
CVS, MRNA, FDX, F, MPC, COF, DOW, PSX, AIG, HPQ, PRU, KR, LYB, WBA, DELL, NUE, ABC, TSN, LEN, MOS, HPE, WDC, SYF, IP, WLK
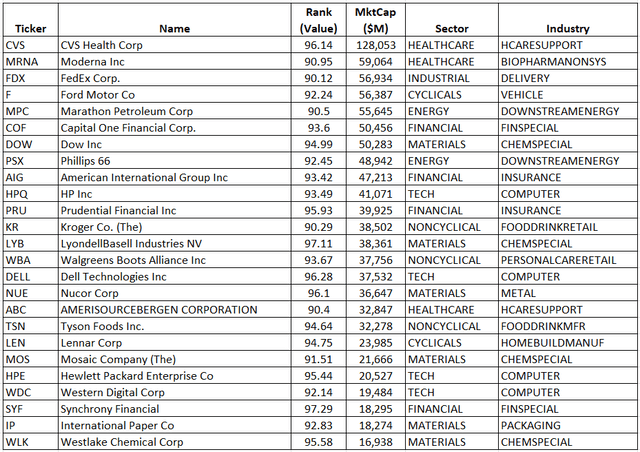
Portfolio123 data, Author Table
Growth
TSLA, XOM , CVX, PFE, MRK, QCOM, COP, CCI, MU, PXD, OXY, FCX, MAR, MPC, VLO, DVN, SNPS, PSX, SYY, WELL, MCHP, HLT, EA, HES, LYB
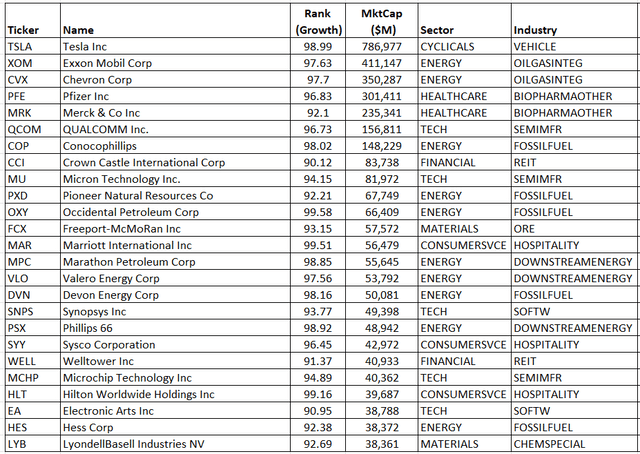
Portfolio123 data, author table
This article was written by

I am an individual investor who is obsessed with finding opportunities for alpha. I invest exclusively in quantitative strategies, through the use of historical data, and by looking at a group of stocks rather than individual securities. I research and develop all of my own alpha generating stock trading strategies using Portfolio123.*As of June 2022, I am actively invested in 6 different quantitative strategies in both US and Canadian markets. Overall annual returns in 2020 of 49% and 2021 of 58%, and in that neighbourhood YTD for 2022 while the overall market has been plunging.*I am a "value guy" at heart, but in my travels and experience I have learned that there is much more to the markets than just "value", so I have adopted a more holistic view, incorporating quantitative elements of growth, quality, momentum and technical factors. * One of the most important lessons I have learned through my journey is that the market is extremely complex and ever-changing, and the use of historical data needs to be interpreted very carefully in order to predict future returns. Early on in my investing journey, I learned this the hard way through investing in poorly developed "over-optimized" models, resulting in underperformance and nearly leading me to give up as a quant to become a common indexer. * Instead I re-focused my efforts on quantitative model development to find my "edge". Successful quantitative investing takes hard work, and I focus my writings on Seeking Alpha on those topics that can help other investors navigate the treacherous yet potentially very profitable arena of quantitative investing. As I often write about strategies or techniques that I implement in my own strategies, I "eat my own cooking". * I invite you to join me on my investing journey, where we will learn about all things quant in the never-ending quest for alpha! * Click the "Follow" button above to receive notifications of my new articles!
Disclosure: I/we have no stock, option or similar derivative position in any of the companies mentioned, and no plans to initiate any such positions within the next 72 hours. I wrote this article myself, and it expresses my own opinions. I am not receiving compensation for it (other than from Seeking Alpha). I have no business relationship with any company whose stock is mentioned in this article.
Additional disclosure: This article is for informational purposes only. I am an individual investor and writer, not an investment advisor. Readers should always engage in his or her own research and consider (as appropriate) consulting a fee-only certified financial planner, licensed discount broker/dealer, flat fee registered investment adviser, certified public accountant, or specialized attorney before making any investment, income tax, or estate planning decisions.
Source: https://seekingalpha.com/article/4516611-factor-momentum-how-recent-factor-performance-predict-future
0 Response to "Continuation of This Momentum in Future Years"
Post a Comment